
Learn analytics
Read your dashboard
Use the main reports to understand traffic, behaviour and connected outcomes.
What it is
The dashboard brings the current site context, date range and supported reports into one place. It is designed to help you move from a change in activity to the report that explains it.
Why use it
Use it for a daily check-in, a campaign review or a first look at whether a site change affected visitor activity.
Before you start
- Choose the correct site and workspace before reading a report.
- Revenue appears only when a supported revenue connection is enabled. Premely keeps mixed currencies separate rather than silently adding them together.
How to use it
- 1
Choose a time range
Start with the range that matches your question. Use Choose an analytics date range to select a recent, monthly, yearly, custom or realtime view.
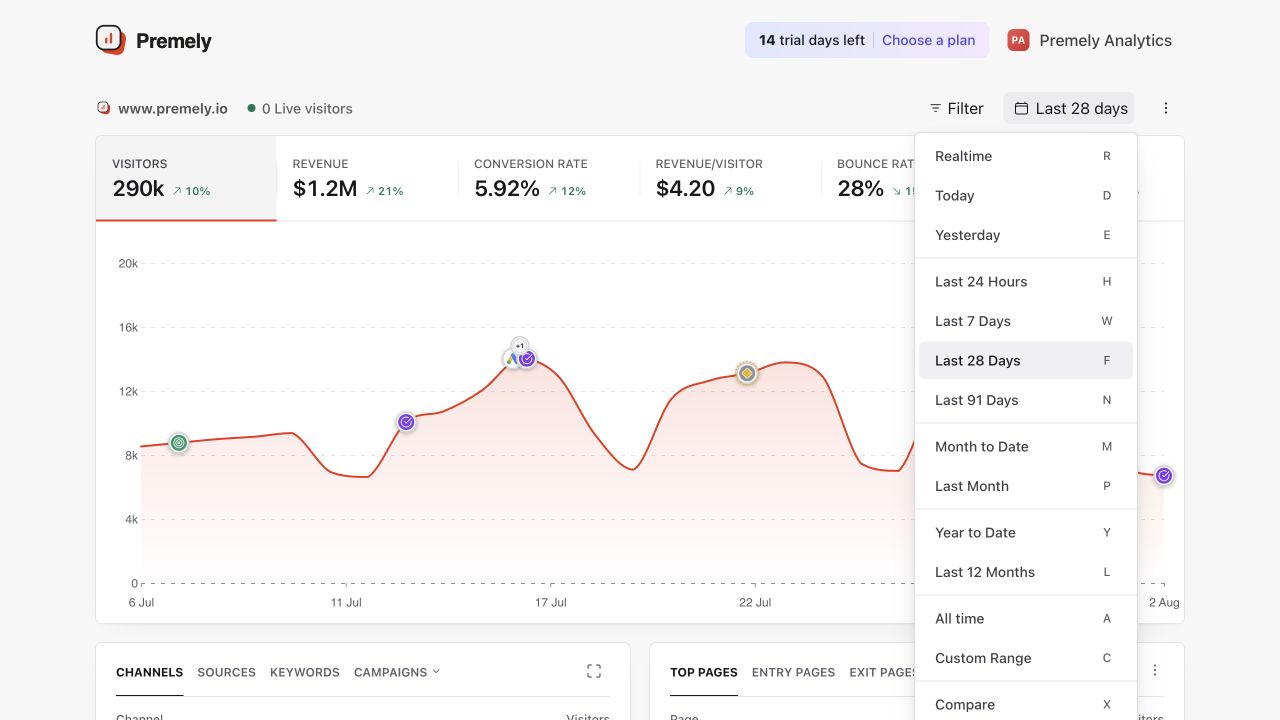
Select the period that matches the decision you are making; use Realtime for verification, not long-term analysis. Shown in Premely with disposable demo data; your values will differ.
- 2
Read the headline metrics
Use visitors, visits and pageviews to understand traffic volume. Then use engagement metrics to see how visits developed.
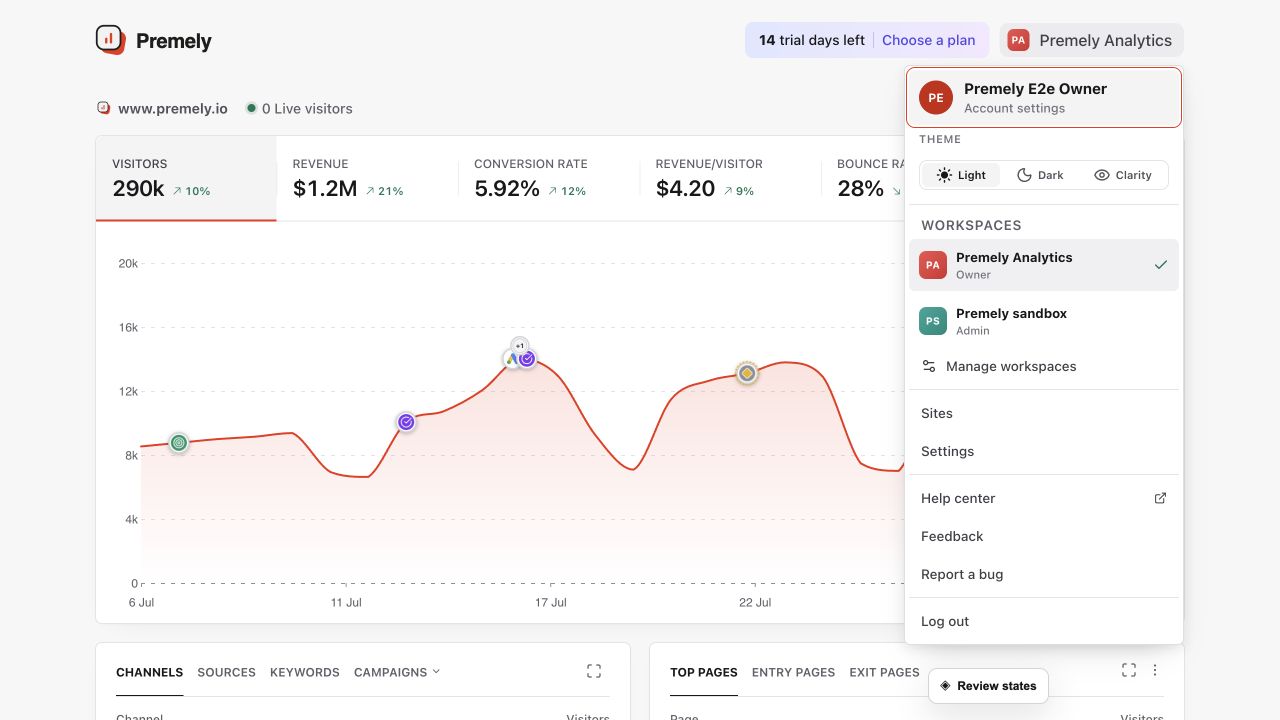
Start with the selected period and headline metrics, then use the supporting reports to explain the change. Shown in Premely with disposable demo data; your values will differ.
- 3
Open the relevant report
Use Sources for where visitors arrived from, Top Pages for content performance, and Countries, Devices, Conversions or Properties when that context answers your question. Use goals when you need to measure a completed action.
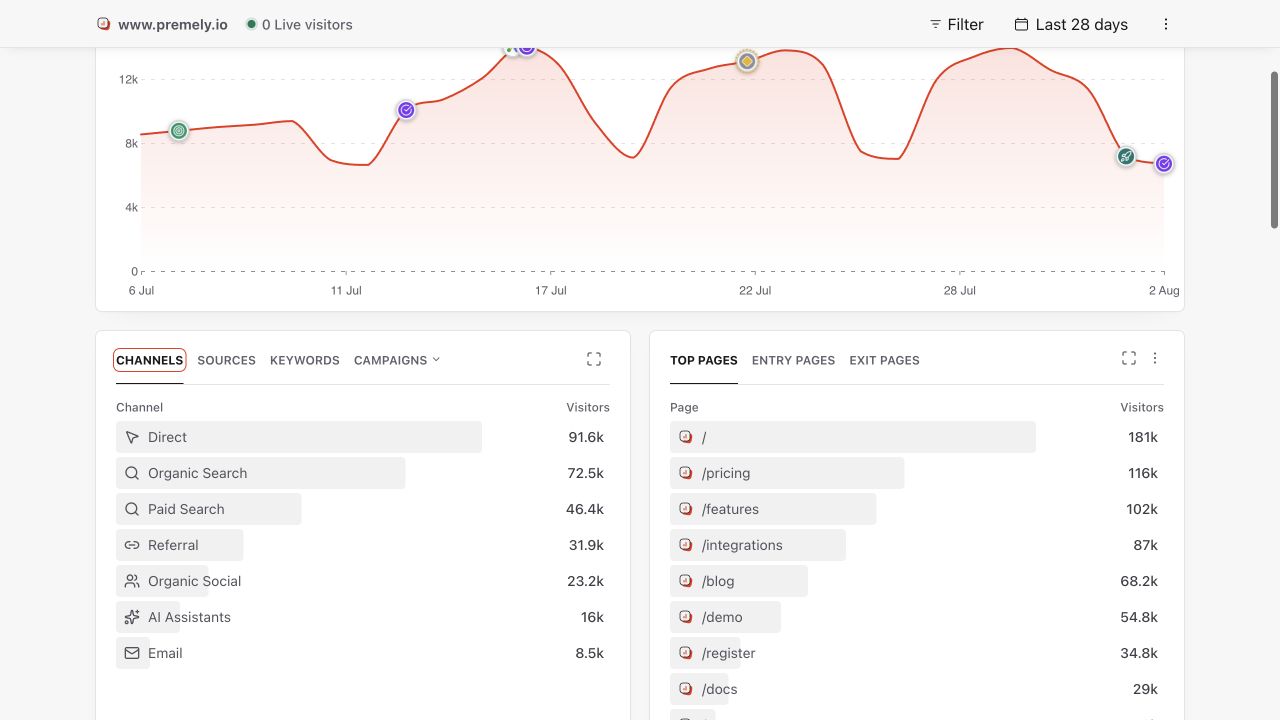
Open the acquisition detail to compare the channels and sources that brought measured visitors. Shown in Premely with disposable demo data; your values will differ.
- 4
Filter with purpose
Apply a filter only when it changes the decision you need to make. Filter website analytics explains the available visit context and why Premely rejects unsupported combinations instead of changing a metric's meaning.
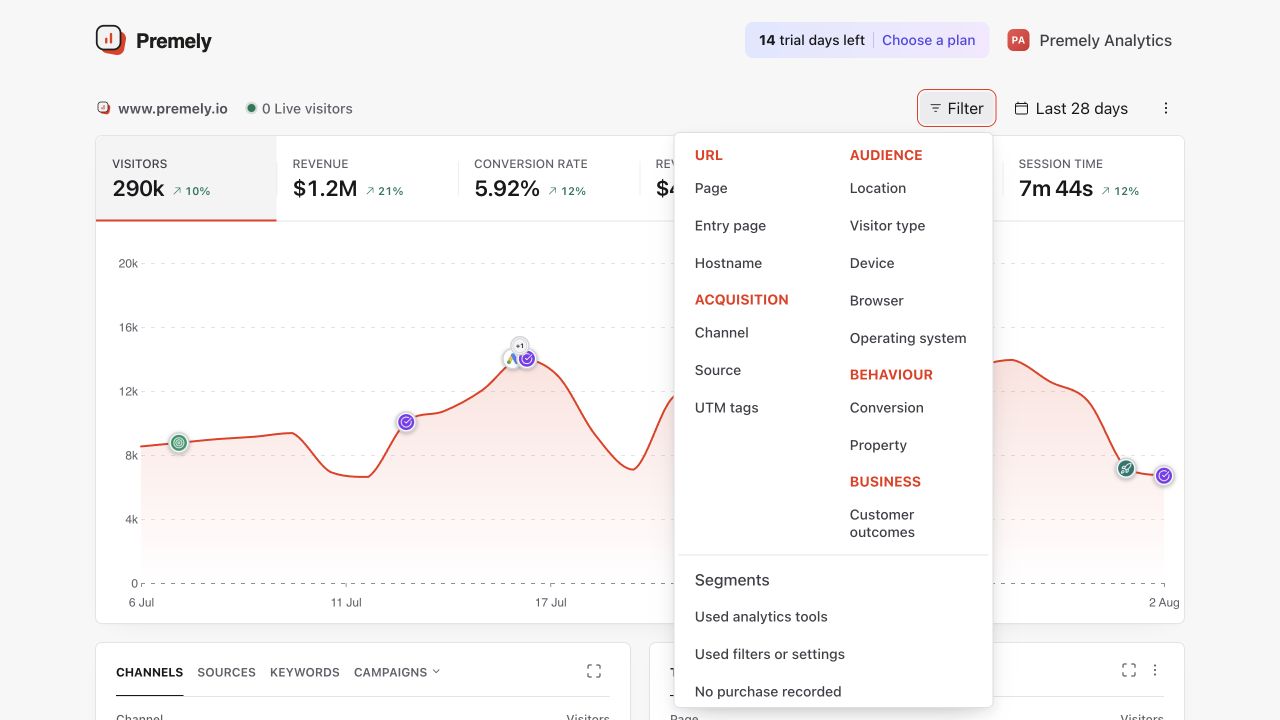
Apply one focused filter, then confirm the active filter before reading the metrics. Shown in Premely with disposable demo data; your values will differ.
What to expect
Empty is not zero
A missing visit-duration value remains empty. It is not shown as zero because that would suggest a measurement Premely did not receive.
Setup and waiting states are explicit
When the site is not yet connected or data is still arriving, use the shown state to return to setup instead of treating an empty report as a result.
Useful ways to apply this
Review a campaign
Compare the campaign period with the report that shows its source, landing page and goal activity.
Find a page to improve
Start with Top Pages, then review the related goals or funnel if the page supports a conversion path.