
Learn analytics
Choose an analytics date range
Match the reporting period and comparison to the website question you need to answer.
What it is
The date range sets the time boundary for every dashboard metric and report. Premely includes realtime, rolling, calendar-based, all-time and custom ranges.
Why use it
Use the shortest range that fully contains the behaviour or outcome you are investigating, then add a relevant comparison when you need context.
Before you start
- Check the site's reporting timezone. Today, Yesterday, calendar months, custom calendar days and chart labels follow that timezone.
- Decide whether you need current activity, recent performance, a complete calendar period or a longer trend before opening the date menu.
How to use it
- 1
Open the date menu and choose a preset
Click the date button above the chart, such as
Last 28 days. ChooseLast 7 Daysfor a recent week,Last Monthfor the previous complete calendar month, orRealtimefor the latest 30 minutes. The menu closes when you choose a preset.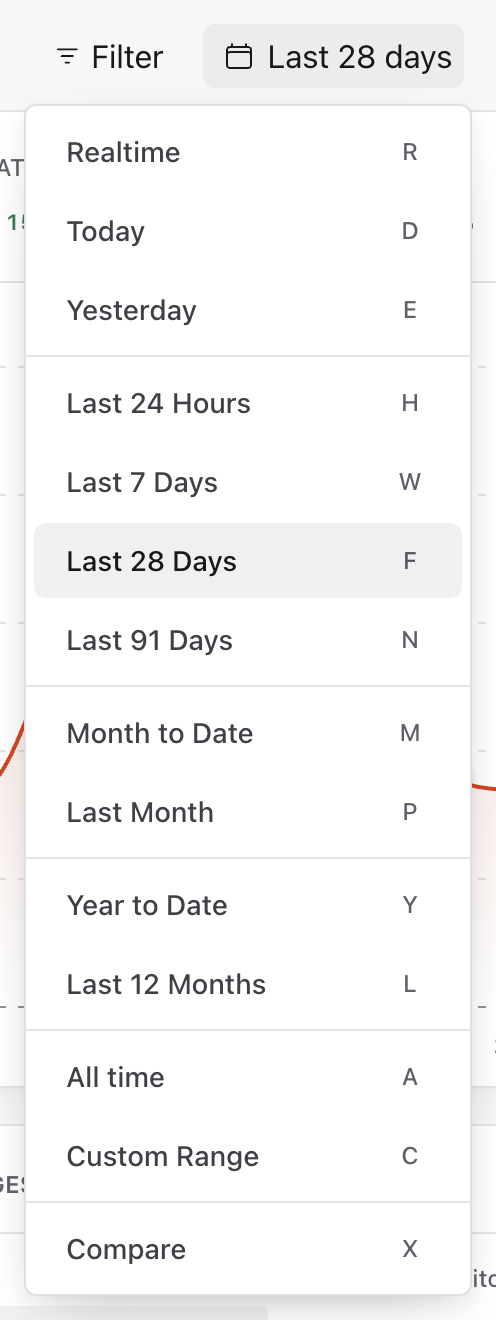
Open the date button, then choose the reporting period. The menu also contains Custom Range and Compare. Captured from the real light-mode interface with disposable demo values; your dates and totals will differ.
- 2
Check the applied reporting period
Confirm the date button now names your selection. Check the chart's date labels before interpreting the totals. In this example,
Last 7 daysreplaces the previous range; it does not add a second filter.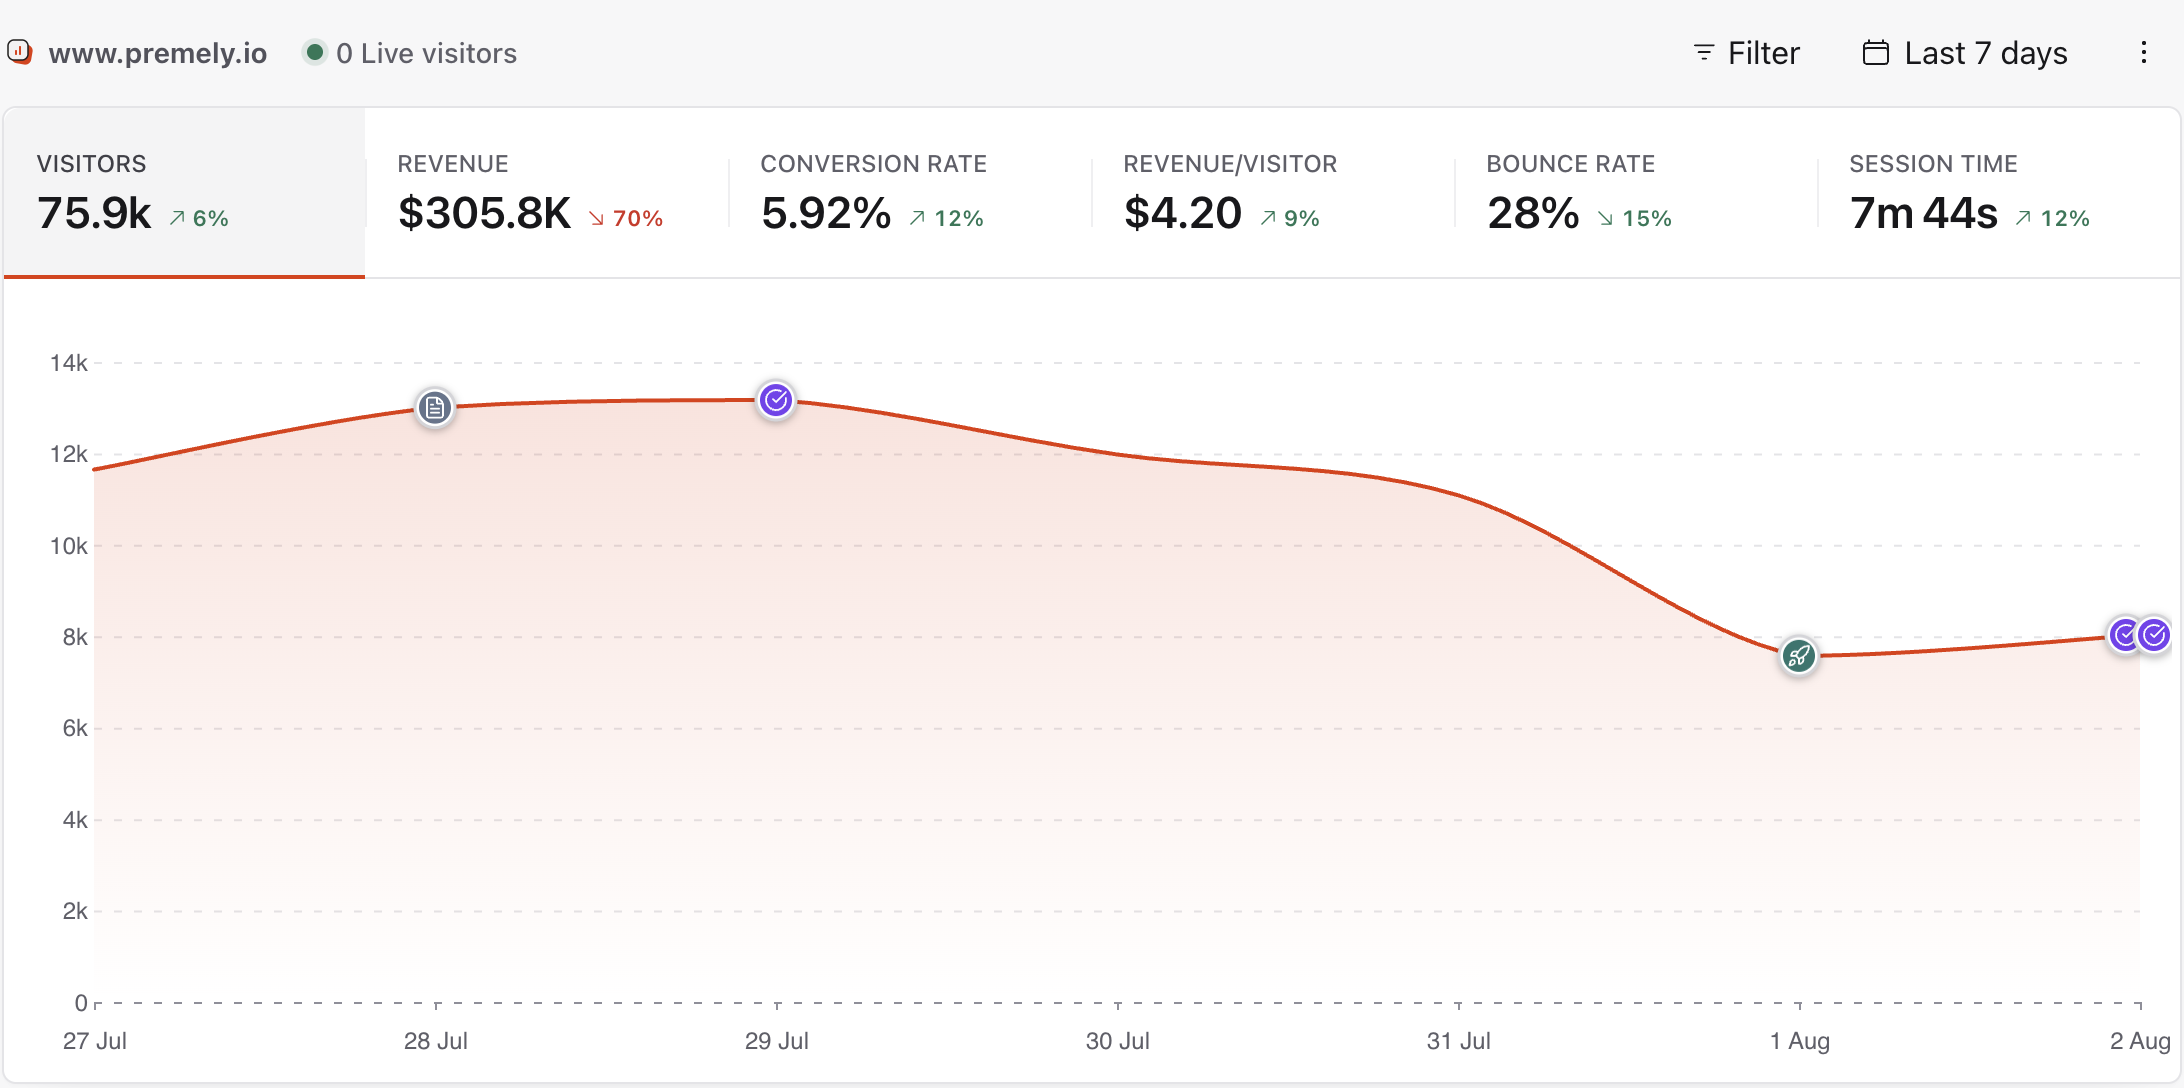
Confirm that the date button says Last 7 days and that the chart covers the intended period. Captured from the real light-mode interface with disposable demo values; your dates and totals will differ.
- 3
Choose the first day of a custom range
For a specific campaign or launch, reopen the date menu and choose
Custom Range. Select the month and year, then click the first day. You can use the arrow controls to move between months. The filled date is your start day.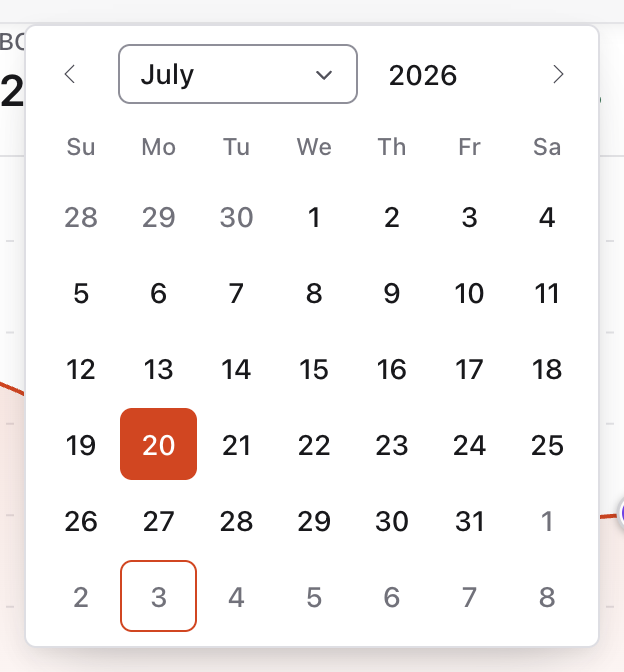
Choose the month and year, then click the first day. The selected start is filled; choose the last day next. Captured from the real light-mode interface with disposable demo values; your dates and totals will differ.
- 4
Choose the last day and confirm both dates
Click the last day to finish the selection. The calendar closes and the date button shows both inclusive dates, such as
20 Jul 2026 - 27 Jul 2026. There is no separate Apply button. The site's reporting timezone determines the calendar-day boundaries.
After choosing the second day, check both dates in the dashboard header. No separate Apply button is needed. Captured from the real light-mode interface with disposable demo values; your dates and totals will differ.
- 5
Choose a comparison and date alignment
Open the date menu and choose
Compare. SelectPrevious period,Same period last yearorCustom comparison. UseMatch day of weekwhen weekday patterns matter, orMatch exact datefor calendar-date alignment. Reopen the comparison choices if you need to adjust the alignment after choosing a period.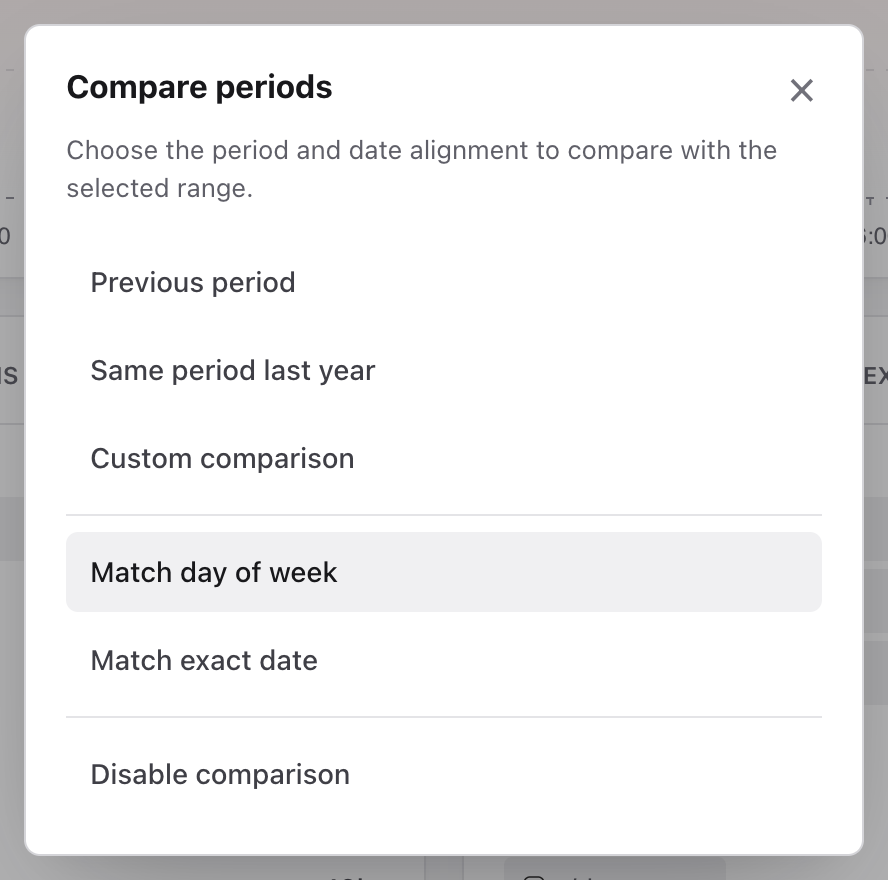
Choose a comparison period. Match day of week and Match exact date control the date alignment. Captured from the real light-mode interface with disposable demo values; your dates and totals will differ.
- 6
Confirm or remove the active comparison
Check the label after
vsbeside the main date range. In this example it saysSame period last year. Click that comparison label to change it, or chooseDisable comparisonin the comparison dialog to return to a single period.
The comparison appears after vs beside the main reporting period. Open it to change or disable the comparison. Captured from the real light-mode interface with disposable demo values; your dates and totals will differ.
What to expect
Rolling and calendar ranges are different
Last 24 hours is a moving 24-hour window. Yesterday is the previous calendar day in the site's reporting timezone. Choose the one that matches the question.
Longer ranges use broader chart intervals
Premely groups short ranges by hour and progressively longer ranges by day, week or month so the chart remains readable without changing the period total.
Useful ways to apply this
Check a release
Use Realtime or Last 24 hours to confirm immediate activity, then review a complete multi-day range before judging performance.
Review monthly growth
Compare Last month with the previous period for adjacent months, or use year over year when seasonality is the stronger baseline.