
Learn analytics
Filter website analytics
Narrow dashboard reports by acquisition, location or device without changing metric meaning.
What it is
An analytics filter limits the dashboard to visits that match a selected condition. Premely supports source, UTM, country, region, city, device, browser and operating-system context in the live dashboard.
Why use it
Use a filter to test a specific explanation, such as whether a traffic increase came from one campaign source or one country.
Before you start
- Read the unfiltered result first so you understand the overall change before narrowing it.
- Choose one filter that directly relates to the question. Multiple unrelated slices can make a small sample look more important than it is.
How to use it
- 1
Choose a filter group
Open
Filterabove the dashboard. For this example, chooseSourceunderAcquisition. UseUTM tagsfor campaign labels,Locationfor country, region or city, or the relevant audience option for device and browser questions.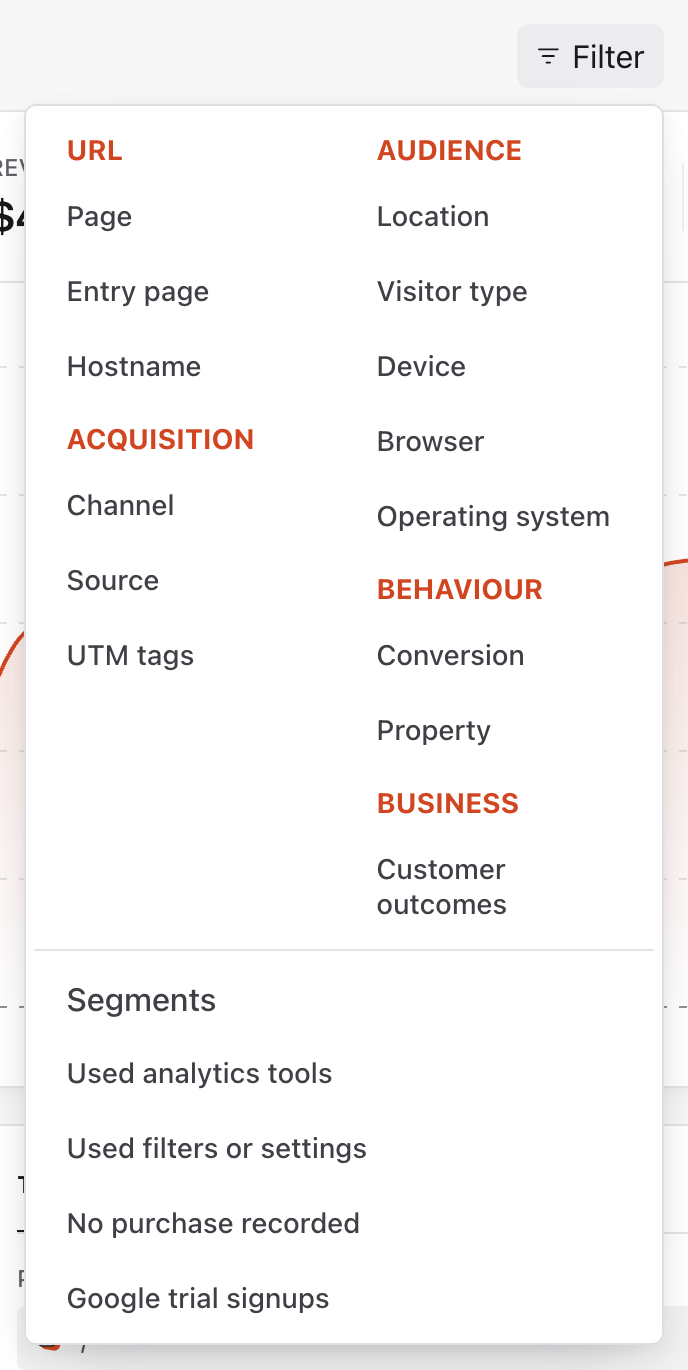
Choose Source under Acquisition for this walkthrough. Other groups narrow the dashboard by page, audience or behaviour. Captured from the real light-mode interface with disposable demo values; your dates and totals will differ.
- 2
Choose the operator
In
Filter by Source, click the operator beside the value field. Chooseisfor an exact source,is notto exclude it, orcontainsordoes not containfor a text match. This walkthrough usesis. Other filter groups can offer different operators.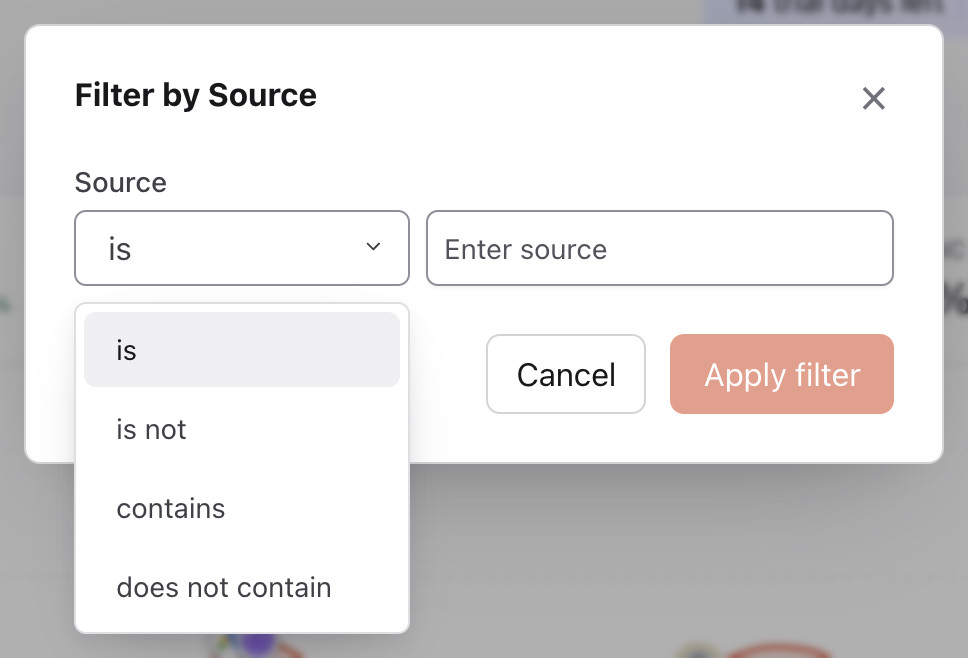
Open the operator beside Source. Choose is to include an exact source, or select another supported condition. Captured from the real light-mode interface with disposable demo values; your dates and totals will differ.
- 3
Enter one meaningful value
Enter a value that appears in your
Sourcesreport, such asGoogle, then clickApply filter. The button stays disabled while the value is empty. Match the report's source name instead of entering an unrelated campaign label or URL.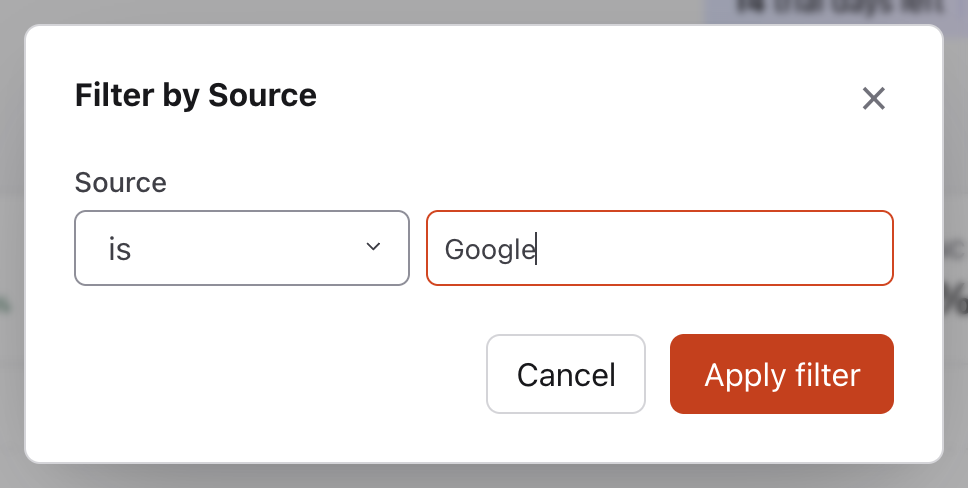
Enter a source that appears in your Sources report, then choose Apply filter. Google is the example source in this walkthrough. Captured from the real light-mode interface with disposable demo values; your dates and totals will differ.
- 4
Read the applied filter
Check the pill above the dashboard. It should show the intended field, operator and value, such as
Source is Google.Filter · 1confirms one active condition. Click the pill if you need to edit it before analysing the matching traffic.
Confirm the field, operator and value in the active filter pill. Use its x to remove that condition, or Clear all to remove every active condition. Captured from the real light-mode interface with disposable demo values; your dates and totals will differ.
- 5
Remove the filter and compare
Click the
xon the filter pill to remove that condition, or chooseClear allto remove every active condition. Confirm the pill disappears and the date range stays unchanged before comparing with the unfiltered result.
The Source pill and active-filter count are gone. The reporting period remains Last 28 days. Captured from the real light-mode interface with disposable demo values; your dates and totals will differ.
What to expect
Session metrics keep their meaning
Views per visit, bounce rate and visit duration are calculated from complete visit context. Premely rejects unsupported event-level combinations instead of treating a matching event as if it were the whole session.
A filter reduces the population
Filtered counts and rates can move sharply when few visits match. Read the absolute values before treating a percentage change as a general pattern.
Useful ways to apply this
Check a campaign source
Filter by UTM source or campaign, then compare visitors, engagement and the matching conversion goal for that visit context.
Investigate a device issue
Filter by device after a release, then compare engagement and conversions with the unfiltered baseline before deciding whether the issue is device-specific.